Module 4: Coastal Flooding
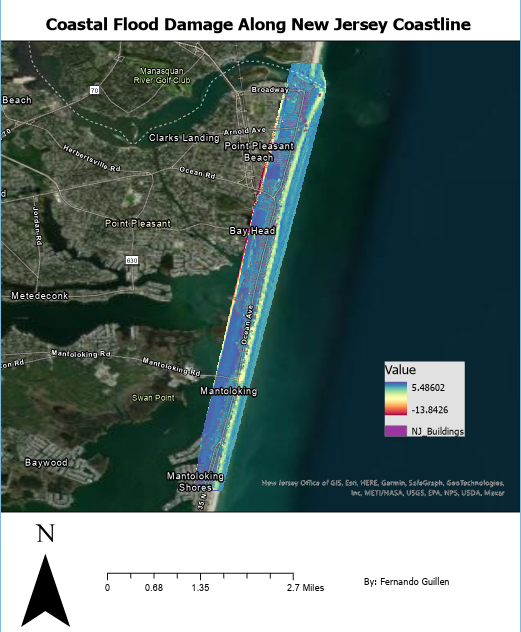
For this module, I had the opportunity to use a DEM to examine the impacts of coastal flooding on certain factors. In creating the DEM, I had to use the familiar LAS Dataset to TIN that I had previously used in a previous module. Therefore, the use of the processing tool was easy to use. In the local scene, I observed pre and post data along the New Jersey coast. I can infer from the data that there is a difference from pre and post images after subtracting them in the Raster Calculator. The higher valued and redder areas are being impacted the most by coastal flooding. This involves resulting erosion and financial burdens. As it transitions into darker colors away from the coastline, it appears that this data displays buildup of debris and possibly soils. After analyzing various bookmarked areas of the mapped dataset, I noticed some buildings have been rebuilt and hotspot areas that were more prone to flood damage. The corresponding map can be viewed below. I also learned how vulnerable many areas of New Jersey are to flooding.
The most challenging part of this module was comparing a USGS DEM and LiDAR DEM. These two elevation models were used to analyze buildings that suffered from a storm surge of 1 meter. The challenging part was being tedious when extracting and selecting by attributes. I used the buildings layer and spatially joined both USGS and LiDAR data. Not only did I have to choose data that fell into only one dataset, but also buildings that fell into both categories. I was able to do this by querying and selecting by the attributes I needed. I then filled out the provided table that contained omission and commission percentages. I calculated this by using # buildings impacted based on Lidar DEM AND NOT impacted based on USGS DEM / total # buildings impacted based on Lidar DEM *100%. To find the omission I just divided the building impact only by the USGS DEM. On a large scale, having a uniform height helps to know when an area is flooded or not. It would be ideal for insurance companies to know what areas to definitely cover. However, I believe that it is also important to include data points that are just below the 1 meter mark that was a minimum. If I was looking to improve infrastructure or include areas into insurance maps, I would definitely include areas that were below the 1 meter mark because even those below could signify potential risk to flooding. What if an area was 0.90 meters at risk? All it takes is a stronger storm event to impact the area and the areas below the 1 meter mark would now all be above. From the table, some commissions and omissions were too large, signifying how inaccurate the data being displayed was for certain building types. One immediate way I would modify my data is to include a larger project area. This would help improve the accuracy that was lacking for some of the building types. I would expand the data being used to the include parts of the coast further up north. Overall, my favorite tool I used was the constant attribute selection and querying. I had used it before, but it felt very challenging keeping track of what I was analyzing for the


Comments
Post a Comment